A Data-Driven Productivity Gain on the Escalation Team
Overview
From October through February, the Escalation team closed out an average of 33 issues per month.
In March, we closed out 43.
In many of our KPI graphs (tickets fixed, resolved, triaged), we saw significant performance improvements. In March, we fixed more bugs than we did in the previous 3 months combined. We did it without changing the volume or the nature of our work; we just changed the sequencing of when we did it.
In this post, I’m going to tell the story of how the Escalation team, with one small process change, significantly improved its productivity. I hope its lessons—on the value of experimentation, self-organizing teams, measurement, and data-driven decisions—prove useful to our readers.
Table of Contents
Recap
The life of a bug has two main phases: the triage phase (where a raw report is turned into an actionable unit of work) and the resolution phase (where a developer commits to fixing—or otherwise resolving—the bug).
In February, we realized that we were were triaging bugs at a faster rate than they were being resolved. That meant that much of the work we were doing in the triage phase was “waste”, since it might never translate into value for our customers.
Our insight was that any work that we could defer from the triage phase to the resolution phase would—theoretically—result in a performance gain without any additional effort on our end. Since only a fraction of bugs that completed the triage phase would be resolved, but all bugs in the resolution phase would be, we realized the value of a unit of effort in the resolution phase is greater than the value of a unit of effort in the triage phase.
When looking closer, we determined that the costliest part of triage was finding the root cause. In some cases, we even found the necessary fix for someone to pick up later. We went through our costly triage process because we wanted bugs to be as easy as possible for engineers to fix once they picked them up. The problem was that bugs weren’t being picked up fast enough to justify that investment.
As an experiment, we singled out this part of triage and deferred it to when we were ready to resolve the bug. Our prediction was that, with the same amount of effort, we’d be able to close out more tickets.
Graphically:


For the month of March, this prediction turned out to be true. 50% more tickets that we triaged were closed out, and the rates at which bugs were resolved and triaged converged:

Not only did our performance improve, but the team was happier, since it meant more time fixing bugs and less time triaging. Everyone felt more productive and cared about their improved productivity.
Crucially, this improvement was only possible because of the Performance Review work that the team did. We had good intentions for our costly triage process: we wanted a ticket to be in an optimal state for a developer to pick it up and fix it. In retrospect, the problem was that tickets weren’t being picked up fast enough to justify that cost. But, since we weren’t measuring the work we were doing triaging, that burden stole upon us silently. Once we started measuring that work, we started seeing exactly how it affected our productivity, and, consequently, which modes of actions would be useful. Our improvement could only work because of the disparity in the rates of triage and resolution; had the data told us something different, we would have had to do something else.
Results (Graphs!)
Ticket Resolution: ↑
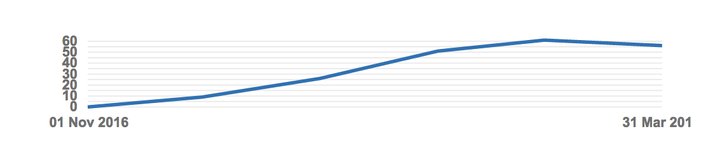
More issues were certainly resolved (meaning fixed or closed for other reasons).
Escalation Triaged Issues
Of the issues we triaged (which are then closed by either us or a dev team), we saw a 50% increase of closed tickets compared to February (50 in March, 33 in February). More importantly, the gap between triaged and resolved bugs narrowed significantly: we triaged 53 issues, and 50 were closed.
Tickets Escalation Resolved
We resolved 65% more tickets in March than February (43 compared to 26):

Tickets Escalation Fixed
Of those, we fixed many more in March than February (17 compared to 5)

Tickets Escalation Triaged and Resolved
Interestingly, we also resolved more bugs that we ourselves triaged, which meant that we were avoiding more of the the kinds of inefficiencies that arise when you triage a bug and then don’t fix it:

For more information, I highly encourage you to peruse our dashboard that keeps track of these statistics.
Time in Triage Phase: Unchanged
The data show that bugs spend the same amount of time as they did before in the triage phase. You can see this in the control chart below:

However, the team is clearly spending less of their time working on issues when they're in this phase. Instead of half a day, they now spend half an hour doing triage. They also have remarked that they have more time to focus on resolving and fixing bugs.
We probably didn't see JIRA-measured triage time go down because the main constraint on triage is waiting on questions to be answered by bug reporters.
Velocity: Unchanged
We measure velocity according to story points, and were expecting to see an increase in story points completed; however, we didn’t see this kind of change as a team. Because we expected to close more bugs without expending more effort, we expected to see its effects reflected in our other metrics. It’s possible that we didn’t take on any large-effort tickets in March, but it’s strange that this number stayed constant. We’ll continue looking at this statistic as well as our other measurements.
Mitigating Factors
We were missing a member of our team for the second two weeks in March, and there was a national holiday in Pakistan that some team members took some additional days off for.
Moving Forward
Going forward, we will continue to restrict triage to the most essential function (i.e., no effort on root cause). It will be interesting to see if we keep up the velocity.
This process introduced some ideas that the team is excited about running with. Everyone is thinking more about process improvement and how we can tangibly measure the impact of our process experiments. While we don’t expect there to be many more easy wins like this one was, we do expect to continue the cycle of experimentation!