cs_comments_service mongoid 4.0.0 upgrade load test results
Load testing is being performed to confirm performance of the forums due to the work in PLAT-730 - Getting issue details... STATUS and the migration from compose.io to in house (AWS). One of the big concerns is that the "identity map" had been removed from mongoid. The identity map acted as a caching layer in the ruby code.
The initial intent here is to validate the performance that Diana Huang saw during her /wiki/spaces/LEARNER/pages/35422940.
First the Basline from the teams test:
"Method" | "Name" | "# requests" | "# failures" | "Median response time" | "Average response time" | "Min response time" | "Max response time" | "Average Content Size" | "Requests/s" |
"GET" | "/commentable_id/threads" | 4341 | 0 | 330 | 459 | 18 | 14183 | 21159 | 2.48 |
"POST" | "/commentable_id/threads" | 1155 | 1 | 40 | 50 | 28 | 537 | 606 | 0.66 |
"GET" | "/search/threads" | 1134 | 0 | 63 | 135 | 34 | 5540 | 15294 | 0.65 |
"GET" | "/threads" | 7722 | 0 | 38 | 47 | 16 | 1158 | 20561 | 4.41 |
"GET" | "/threads/thread_id" | 30416 | 0 | 41 | 49 | 27 | 1104 | 5581 | 17.38 |
"POST" | "/threads/thread_id/comments" | 1062 | 7 | 120 | 132 | 67 | 969 | 525 | 0.61 |
"PUT" | "/threads/thread_id/votes" | 1102 | 0 | 32 | 44 | 25 | 420 | 1114 | 0.63 |
"GET" | "/users/user_id" | 54919 | 0 | 12 | 14 | 8 | 1036 | 52 | 31.37 |
"PUT" | "/users/user_id" | 4413 | 0 | 20 | 25 | 15 | 1046 | 62 | 2.52 |
"GET" | "/users/user_id/active_threads" | 1083 | 0 | 23 | 28 | 6 | 890 | 43 | 0.62 |
"GET" | "/users/user_id/subscribed_threads" | 1080 | 0 | 23 | 29 | 20 | 1056 | 40 | 0.62 |
"POST" | "/users/user_id/subscriptions" | 1067 | 0 | 24 | 30 | 16 | 221 | 95 | 0.61 |
"None" | "Total" | 109494 | 8 | 21 | 48 | 6 | 14183 | 4050 | 62.55 |
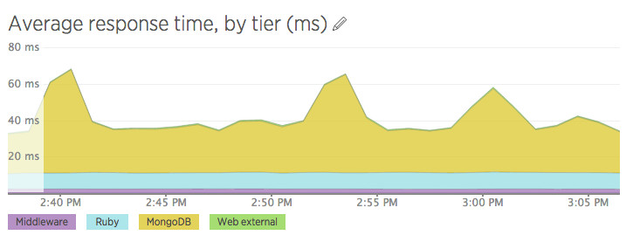
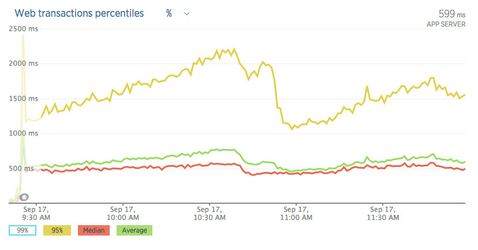
New Relic data: https://rpm.newrelic.com/accounts/88178/notes/4600
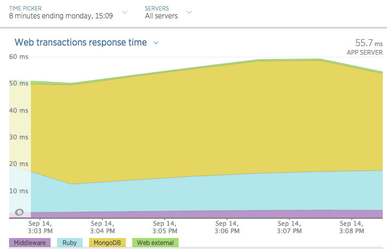
We can see by looking at this data that most of teh requests average response times are around 25 ms. Looking at the charts in new Relic we can see that the majority of this time is spent in the mongodb layer:
Quick test 1 mongoid 4.0.2
"Method" | "Name" | "# requests" | "# failures" | "Median response time" | "Average response time" | "Min response time" | "Max response time" | "Average Content Size" | "Requests/s" |
"GET" | "/commentable_id/threads" | 1054 | 0 | 68 | 113 | 25 | 1507 | 20911 | 5.08 |
"POST" | "/commentable_id/threads" | 236 | 0 | 160 | 190 | 35 | 1527 | 629 | 1.14 |
"GET" | "/search/threads" | 265 | 0 | 140 | 244 | 37 | 2205 | 16065 | 1.28 |
"GET" | "/threads" | 1714 | 0 | 66 | 108 | 30 | 2140 | 17459 | 8.26 |
"GET" | "/threads/thread_id" | 7227 | 8 | 59 | 103 | 25 | 1575 | 901 | 34.82 |
"POST" | "/threads/thread_id/comments" | 254 | 0 | 220 | 267 | 74 | 930 | 529 | 1.22 |
"PUT" | "/threads/thread_id/votes" | 231 | 0 | 68 | 96 | 26 | 488 | 572 | 1.11 |
"GET" | "/users/user_id" | 12642 | 0 | 16 | 34 | 8 | 1413 | 56 | 60.92 |
"PUT" | "/users/user_id" | 966 | 0 | 16 | 32 | 9 | 991 | 62 | 4.65 |
"GET" | "/users/user_id/active_threads" | 264 | 0 | 37 | 66 | 20 | 1147 | 40 | 1.27 |
"GET" | "/users/user_id/subscribed_threads" | 226 | 0 | 47 | 75 | 20 | 410 | 40 | 1.09 |
"POST" | "/users/user_id/subscriptions" | 262 | 0 | 30 | 53 | 17 | 334 | 128 | 1.26 |
"None" | "Total" | 25341 | 8 | 37 | 69 | 8 | 2205 | 2524 | 122.10 |
Quick test 2 Mongoid 4.0.2
"Method" | "Name" | "# requests" | "# failures" | "Median response time" | "Average response time" | "Min response time" | "Max response time" | "Average Content Size" | "Requests/s" |
"GET" | "/commentable_id/threads" | 6435 | 0 | 120 | 160 | 25 | 1783 | 21013 | 4.27 |
"POST" | "/commentable_id/threads" | 1634 | 0 | 230 | 282 | 45 | 3620 | 629 | 1.08 |
"GET" | "/search/threads" | 1608 | 0 | 240 | 370 | 40 | 4335 | 16433 | 1.07 |
"GET" | "/threads" | 11042 | 0 | 200 | 256 | 39 | 2963 | 17249 | 7.33 |
"GET" | "/threads/thread_id" | 44225 | 42 | 260 | 337 | 40 | 2769 | 3236 | 29.36 |
"POST" | "/threads/thread_id/comments" | 1537 | 2 | 380 | 442 | 78 | 4831 | 530 | 1.02 |
"PUT" | "/threads/thread_id/votes" | 1566 | 0 | 120 | 150 | 24 | 1224 | 573 | 1.04 |
"GET" | "/users/user_id" | 79514 | 0 | 89 | 122 | 14 | 2097 | 56 | 52.79 |
"PUT" | "/users/user_id" | 6352 | 0 | 24 | 37 | 9 | 1370 | 62 | 4.22 |
"GET" | "/users/user_id/active_threads" | 1545 | 0 | 130 | 172 | 29 | 1344 | 53 | 1.03 |
"GET" | "/users/user_id/subscribed_threads" | 1607 | 0 | 82 | 117 | 25 | 1502 | 41 | 1.07 |
"POST" | "/users/user_id/subscriptions" | 1599 | 0 | 71 | 106 | 18 | 1431 | 128 | 1.06 |
"None" | "Total" | 158664 | 44 | 130 | 197 | 9 | 4831 | 3171 | 105.34 |
Overnight Soak Test 1
"Method" | "Name" | "# requests" | "# failures" | "Median response time" | "Average response time" | "Min response time" | "Max response time" | "Average Content Size" | "Requests/s" |
"GET" | "/commentable_id/threads" | 101926 | 0 | 86 | 102 | 26 | 10784 | 21044 | 1.99 |
"POST" | "/commentable_id/threads" | 25470 | 0 | 200 | 244 | 44 | 2232 | 629 | 0.50 |
"GET" | "/search/threads" | 25151 | 0 | 210 | 304 | 41 | 19457 | 16303 | 0.49 |
"GET" | "/threads" | 177330 | 0 | 190 | 246 | 41 | 10872 | 17244 | 3.46 |
"GET" | "/threads/thread_id" | 708856 | 671 | 380 | 486 | 46 | 11743 | 11165 | 13.84 |
"POST" | "/threads/thread_id/comments" | 25331 | 24 | 290 | 348 | 81 | 11524 | 529 | 0.49 |
"PUT" | "/threads/thread_id/votes" | 25266 | 0 | 93 | 122 | 27 | 10652 | 577 | 0.49 |
"GET" | "/users/user_id" | 1268480 | 0 | 130 | 170 | 21 | 10967 | 56 | 24.77 |
"PUT" | "/users/user_id" | 101212 | 0 | 26 | 36 | 9 | 10794 | 62 | 1.98 |
"GET" | "/users/user_id/active_threads" | 25739 | 0 | 150 | 194 | 33 | 5182 | 75 | 0.50 |
"GET" | "/users/user_id/subscribed_threads" | 25445 | 0 | 84 | 114 | 26 | 1494 | 47 | 0.50 |
"POST" | "/users/user_id/subscriptions" | 25310 | 0 | 74 | 100 | 20 | 2042 | 128 | 0.49 |
"None" | "Total" | 2535516 | 695 | 170 | 258 | 9 | 19457 | 5385 | 49.51 |
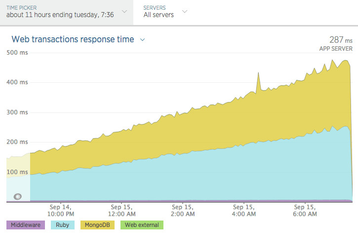
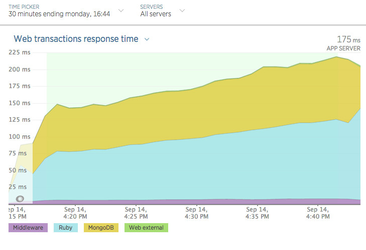
During the soak test the response times continued to ramp up continuously. Reviewing the load tests a data dump is required from the production data. This data is then used to create new comments on the existing set of threads that was pulled out during the data dump, thus causing the number of comments to continuously increase for a thread. The same also holds true for the number of threads on a course, since there is a limited number of courses pulled in for the load tests the number of threads on a course grows unbounded during the course of the load test. I believe that this skews the results of all the load tests that have been run on the internal mongodb installation.
Forums code from master test
"Method" | "Name" | "# requests" | "# failures" | "Median response time" | "Average response time" | "Min response time" | "Max response time" | "Average Content Size" | "Requests/s" |
"GET" | "/commentable_id/threads" | 94600 | 0 | 120 | 134 | 27 | 1968 | 21058 | 1.68 |
"POST" | "/commentable_id/threads" | 24414 | 0 | 400 | 432 | 75 | 2976 | 629 | 0.43 |
"GET" | "/search/threads" | 23378 | 0 | 430 | 509 | 53 | 8802 | 16155 | 0.41 |
"GET" | "/threads" | 165410 | 0 | 420 | 451 | 73 | 3234 | 17227 | 2.93 |
"GET" | "/threads/thread_id" | 661562 | 0 | 660 | 713 | 74 | 3884 | 9668 | 11.73 |
"POST" | "/threads/thread_id/comments" | 23632 | 0 | 830 | 853 | 152 | 2899 | 529 | 0.42 |
"PUT" | "/threads/thread_id/votes" | 23835 | 0 | 180 | 217 | 39 | 1960 | 577 | 0.42 |
"GET" | "/users/user_id" | 1182358 | 0 | 320 | 351 | 50 | 2491 | 56 | 20.97 |
"PUT" | "/users/user_id" | 94151 | 0 | 20 | 27 | 9 | 1736 | 62 | 1.67 |
"GET" | "/users/user_id/active_threads" | 23767 | 0 | 350 | 378 | 62 | 2635 | 133 | 0.42 |
"GET" | "/users/user_id/subscribed_threads" | 23838 | 0 | 180 | 223 | 42 | 1536 | 54 | 0.42 |
"POST" | "/users/user_id/subscriptions" | 23386 | 0 | 150 | 184 | 30 | 2038 | 128 | 0.41 |
"None" | "Total" | 2364331 | 0 | 360 | 441 | 9 | 8802 | 4964 | 41.93 |
Outstanding questions:
- Even when the number of threads/comments were lower significantly more time was being spent on the internal mongodb cluster than in the compose.io cluster. Why?
- There are 2 outstanding dev-ops tickets to check the configuration of the mongodb cluster and it's data load job:
- DEVOPS-2870 - Getting issue details... STATUS
- DEVOPS-2869 - Getting issue details... STATUS
- There are 2 outstanding dev-ops tickets to check the configuration of the mongodb cluster and it's data load job:
- Why was the load test still slow after the data reload? (see tickets above)
- How can we write a load test that better represents how the forums are used in production
- We should consider doing away with seed data and possibly see data ourselves during the init phase of locust