Mongoid 5.0.0 load test results
Baseline Mongoid 3.0.15
| Locust master/slaves | 1 / 4 |
| Users | 50 |
| Spawn rate | 2 |
| Start Time | 17:00 |
| End Time | 21:30 |
Requests:
"Method" | "Name" | "# requests" | "# failures" | "Median response time" | "Average response time" | "Min response time" | "Max response time" | "Average Content Size" | "Requests/s" |
"GET" | "/commentable_id/threads" | 38080 | 0 | 28 | 39 | 17 | 2043 | 12755 | 2.51 |
"POST" | "/commentable_id/threads" | 9434 | 15 | 37 | 52 | 29 | 997 | 635 | 0.62 |
"GET" | "/search/threads" | 9401 | 1 | 59 | 102 | 34 | 9712 | 13041 | 0.62 |
"GET" | "/threads" | 66481 | 0 | 40 | 53 | 17 | 13557 | 19589 | 4.37 |
"GET" | "/threads/thread_id" | 266107 | 0 | 41 | 51 | 23 | 3245 | 5742 | 17.51 |
"POST" | "/threads/thread_id/comments" | 9468 | 15 | 89 | 110 | 68 | 2019 | 536 | 0.62 |
"PUT" | "/threads/thread_id/votes" | 9577 | 0 | 28 | 40 | 20 | 3310 | 792 | 0.63 |
"GET" | "/users/user_id" | 474621 | 0 | 12 | 19 | 9 | 2621 | 70 | 31.23 |
"PUT" | "/users/user_id" | 38140 | 0 | 12 | 19 | 9 | 1058 | 62 | 2.51 |
"GET" | "/users/user_id/active_threads" | 9503 | 0 | 23 | 31 | 6 | 1786 | 47 | 0.63 |
"GET" | "/users/user_id/subscribed_threads" | 9545 | 0 | 26 | 34 | 20 | 1258 | 40 | 0.63 |
"POST" | "/users/user_id/subscriptions" | 9468 | 0 | 21 | 31 | 15 | 481 | 97 | 0.62 |
| "Total" | 949825 | 31 | 26 | 34 | 6 | 13557 | 3679 | 62.50 |
Distribution:
"Name" | "# requests" | "50%" | "66%" | "75%" | "80%" | "90%" | "95%" | "98%" | "99%" | "100%" |
"GET /commentable_id/threads" | 38080 | 28 | 31 | 36 | 42 | 68 | 87 | 130 | 230 | 2043 |
"POST /commentable_id/threads" | 9434 | 37 | 44 | 53 | 65 | 88 | 120 | 170 | 220 | 997 |
"GET /search/threads" | 9401 | 59 | 80 | 99 | 120 | 160 | 240 | 490 | 820 | 9712 |
"GET /threads" | 66481 | 40 | 45 | 53 | 63 | 86 | 110 | 170 | 250 | 13557 |
"GET /threads/thread_id" | 266107 | 41 | 47 | 54 | 64 | 86 | 100 | 140 | 170 | 3245 |
"POST /threads/thread_id/comments" | 9468 | 89 | 110 | 120 | 130 | 170 | 210 | 280 | 340 | 2019 |
"PUT /threads/thread_id/votes" | 9577 | 28 | 33 | 38 | 44 | 69 | 89 | 130 | 170 | 3310 |
"GET /users/user_id" | 474621 | 12 | 13 | 15 | 19 | 42 | 59 | 89 | 120 | 2621 |
"PUT /users/user_id" | 38140 | 12 | 13 | 15 | 18 | 41 | 58 | 89 | 120 | 1058 |
"GET /users/user_id/active_threads" | 9503 | 23 | 25 | 29 | 32 | 57 | 75 | 110 | 140 | 1786 |
"GET /users/user_id/subscribed_threads" | 9545 | 26 | 28 | 32 | 35 | 59 | 77 | 110 | 130 | 1258 |
"POST /users/user_id/subscriptions" | 9468 | 21 | 24 | 29 | 32 | 57 | 77 | 110 | 140 | 481 |
"Total" | 949825 | 26 | 36 | 42 | 46 | 70 | 92 | 130 | 170 | 13557 |
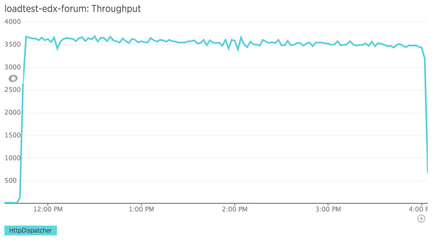
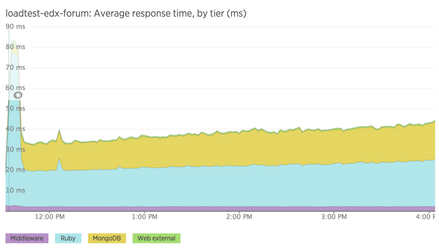
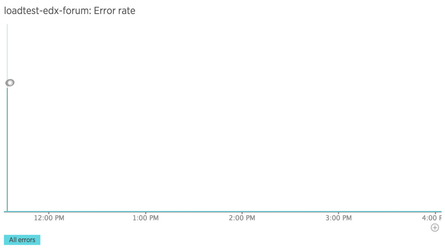
New Relic Notes:
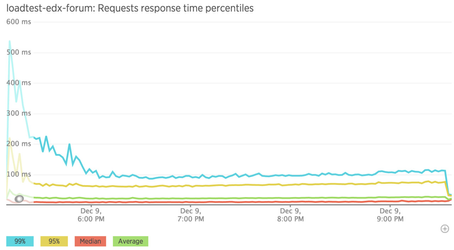 | 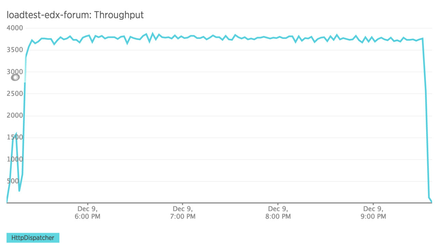 |
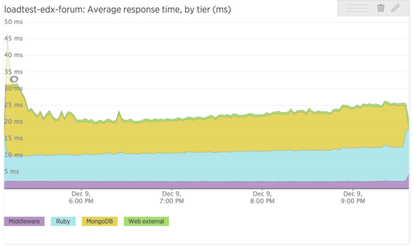 | 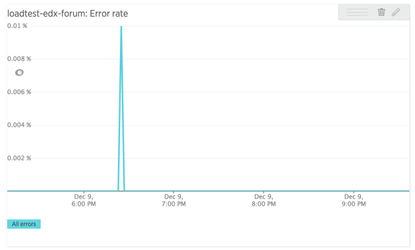 |
Due to the way the load test is designed (a set of threads is selected at the start of the test and comments are added to these threads causing them to balloon in size the longer the test runs) we do see some ramping in response time. Overall the API responds as expected.
Mongoid 5.0.0
| Locust master/slaves | 1 / 4 |
| Users | 50 |
| Spawn rate | 2 |
| Start Time | 11:30 |
| End Time | 16:00 |
Requests:
"Method" | "Name" | "# requests" | "# failures" | "Median response time" | "Average response time" | "Min response time" | "Max response time" | "Average Content Size" | "Requests/s" |
"GET" | "/commentable_id/threads" | 36803 | 0 | 42 | 66 | 24 | 1600 | 12790 | 2.36 |
"POST" | "/commentable_id/threads" | 9117 | 11 | 53 | 78 | 41 | 6062 | 651 | 0.59 |
"GET" | "/search/threads" | 9283 | 0 | 81 | 118 | 43 | 8075 | 12776 | 0.60 |
"GET" | "/threads" | 64572 | 0 | 57 | 81 | 25 | 1992 | 17760 | 4.15 |
"GET" | "/threads/thread_id" | 257605 | 0 | 80 | 103 | 38 | 2633 | 10859 | 16.54 |
"POST" | "/threads/thread_id/comments" | 9107 | 14 | 96 | 120 | 73 | 3484 | 535 | 0.58 |
"PUT" | "/threads/thread_id/votes" | 9199 | 0 | 44 | 67 | 28 | 1143 | 794 | 0.59 |
"GET" | "/users/user_id" | 457460 | 0 | 19 | 40 | 13 | 3501 | 70 | 29.37 |
"PUT" | "/users/user_id" | 36423 | 0 | 14 | 34 | 10 | 1590 | 62 | 2.34 |
"GET" | "/users/user_id/active_threads" | 9045 | 0 | 35 | 56 | 7 | 705 | 61 | 0.58 |
"GET" | "/users/user_id/subscribed_threads" | 9201 | 0 | 43 | 64 | 31 | 1340 | 40 | 0.59 |
"POST" | "/users/user_id/subscriptions" | 9181 | 0 | 32 | 53 | 20 | 1935 | 129 | 0.59 |
"Total" | 916996 | 25 | 48 | 64 | 7 | 8075 | 5003 | 58.88 |
Distribution:
"Name" | "# requests" | "50%" | "66%" | "75%" | "80%" | "90%" | "95%" | "98%" | "99%" | "100%" |
"GET /commentable_id/threads" | 36803 | 42 | 52 | 65 | 88 | 130 | 180 | 260 | 300 | 1600 |
"POST /commentable_id/threads" | 9117 | 53 | 64 | 79 | 98 | 140 | 180 | 260 | 330 | 6062 |
"GET /search/threads" | 9283 | 81 | 110 | 140 | 160 | 210 | 270 | 370 | 500 | 8075 |
"GET /threads" | 64572 | 57 | 69 | 88 | 110 | 140 | 190 | 270 | 320 | 1992 |
"GET /threads/thread_id" | 257605 | 80 | 98 | 120 | 140 | 170 | 220 | 290 | 340 | 2633 |
"POST /threads/thread_id/comments" | 9107 | 96 | 120 | 140 | 150 | 190 | 240 | 310 | 370 | 3484 |
"PUT /threads/thread_id/votes" | 9199 | 44 | 55 | 70 | 91 | 130 | 180 | 240 | 300 | 1143 |
"GET /users/user_id" | 457462 | 19 | 25 | 35 | 51 | 97 | 140 | 200 | 260 | 3501 |
"PUT /users/user_id" | 36423 | 14 | 18 | 29 | 40 | 88 | 130 | 190 | 240 | 1590 |
"GET /users/user_id/active_threads" | 9045 | 35 | 44 | 54 | 70 | 110 | 160 | 210 | 270 | 705 |
"GET /users/user_id/subscribed_threads" | 9201 | 43 | 52 | 62 | 79 | 120 | 170 | 230 | 280 | 1340 |
"POST /users/user_id/subscriptions" | 9181 | 32 | 41 | 51 | 67 | 110 | 150 | 220 | 280 | 1935 |
"Total" | 916998 | 48 | 70 | 83 | 94 | 140 | 180 | 250 | 300 | 8075 |
New Relic Notes
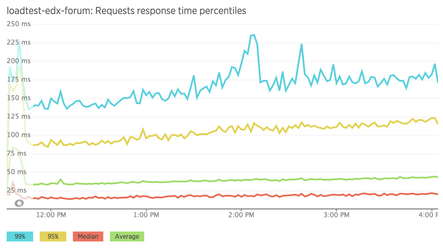 |  |
 |  |