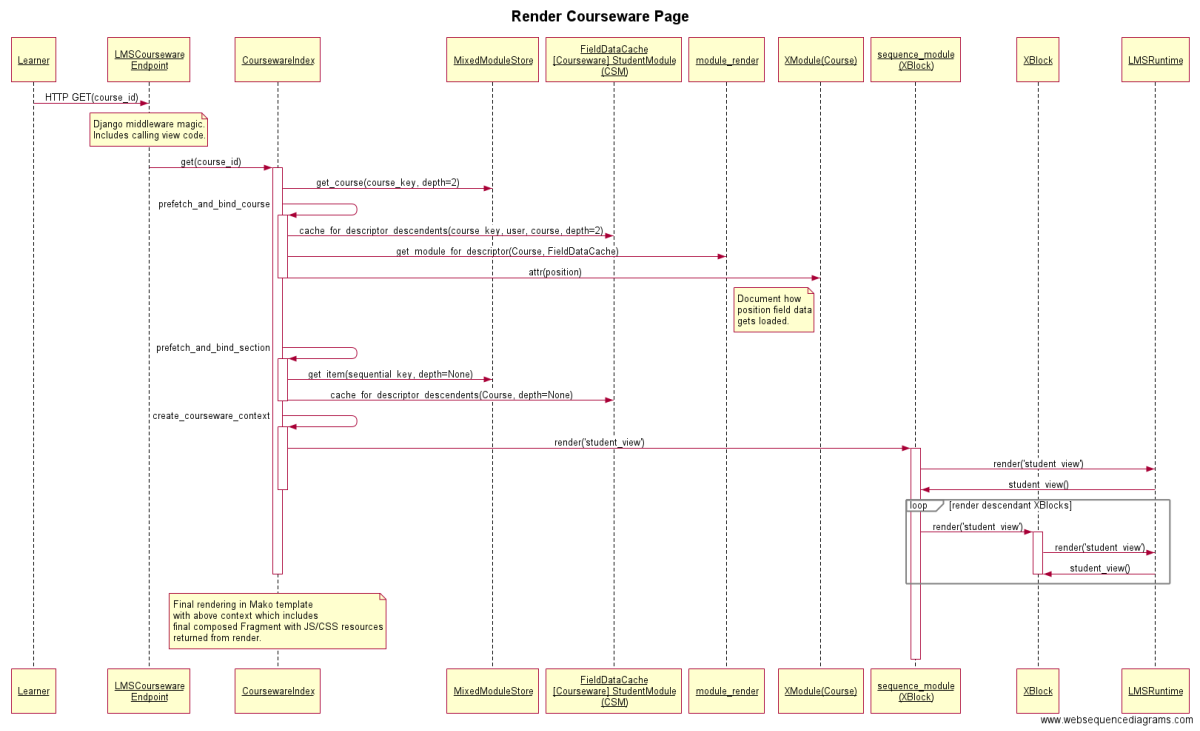
The following diagrams were created to help understand what happens when a general Courseware page is rendered to the browser.
| Table of Contents | ||||
|---|---|---|---|---|
|
Sequence Diagram
Class Diagram
The following is a class diagram of those needed for rendering courseware and XBlocks.
| Lucidchart | ||||||||||||||||||||||
|---|---|---|---|---|---|---|---|---|---|---|---|---|---|---|---|---|---|---|---|---|---|---|
|