This document summarizes learnings from product management that we would like to apply in the developer-facing Arch and SRE teams. It also includes a standardized set of practices that we propose to externalize our work.
References
Outcomes over Output
An outcome is a measurable change in user behavior.
The goal of any feature you ship to a user should be to change the user’s behavior in a measurable and positive way.
User behavior <A> changes from <x> to <y> over timeframe <t>. |
Outcome Hierarchy
A hierarchy of outcomes allows a team to connect their team’s outcomes to an overall business impact: business outcome, product outcomes, traction metrics.
A. Business outcome: reduce time-to-market, via developer efficiency
The average amount of time for a developer to start a task to merge the changes into version control is reduced by 30%. (Developer value stream prior to SRE’s Accelerate metrics.) |
B. Product outcomes: reduce developer context-switching while working on a developer task
The average number of times that a developer context switches to another task on a daily basis is reduced by 30%. |
C. Traction metrics: feature usage and performance
The 95% duration that a developer waits on the most frequently used command in their local development is reduced by 30%. |
When developers have a question on local development, they discover the answer 3x faster than before. |
Developers run 3x more local development commands in a week. |
Developers post 3x less frequently in the devstack-questions slack channel. |
Product outcomes
Product outcomes:
connect to the business outcome
connect to the human behavioral change, and to a moment in time of the user’s journey
must be a metric that the team is able to move on their own
are negotiated with the leader - are they aggressive enough?
🚫 Anti-pattern: Feature Factory
If you ship a feature, and it doesn’t have the desired outcome, did you succeed?
Many software teams struggle to deliver value to users. More often than not, it’s because:
product and engineering teams stopped talking to users
they don’t measure whether what they delivered (features) had the desired impact
don’t measure at all
measure the wrong thing
They are stuck in a feature factory, just “building stuff” and churning out features — and hoping that someone will use it.
Shipping a feature does not equal success. Changing users’ behavior in measurable and positive ways is what leads to success.
🚫 Anti-pattern: Project-mindset
To foster an outcomes-based flow of value, teams need to move away from thinking about delivering projects, to instead having long-term user-centric:
ownership of a product or
support of a platform as a service.
🚫 Anti-pattern: Push Adoption of unneeded solutions
By emphasizing the prioritization of problems instead of the prioritization of technical solutions, teams can focus energy on continual learning of the user’s problem space. This shift in mindset from delivering solutions to solving problems enables the team to discover users' needs, desires, and delights, which can also evolve over time.
This is different from a solutions-first approach, where a solution is chosen before fully understanding the problem space, and then pushed to be adopted by users.
🚫 Anti-pattern: Metrics that don’t connect to business outcomes
The following measures tell us very little about the business impact of the work:
Feature metrics: Performance of a feature (How many people are using it? Is it quicker or easier for a user to do X now than it was before?)
Product metrics: Performance of specific product objectives (Because of feature X, more people are using functionality Y)
Team metrics: How many story points/features were launched at the end of the month/quarter? (This will only lead to — at best — success theatre, and at worse, the wrong behaviors from all parties)
A more business-centric way to build and manage a product is by measuring our efforts in terms of outcomes, not output. When we measure outcomes, we measure the impact the new features had on the activity of the users AND the success of the company.
Continuous Learning via User-centricity & User-first
Using data that is regularly gathered from users, we build user insights, which inform our hypotheses. Being user-first, we ask questions and actively listen in order to form hypotheses, without making assumptions and jumping to conclusions/solutions on behalf of our users. Being user-centric, we keep the voice and perspective of the user in mind as we prioritize, design, develop, validate → and continuously learn and iterate.
Opportunity trees and Product Katas (see below) are tools to enable continuous learning and refining of the user-problem space. We continue to discover opportunities through regular user touchpoints.
To ensure user-centricity, opportunities are phrased from the user’s point of view. Tie the opportunity to a specific moment in time.
Opportunities = user needs, user pain points, user desires, or user questions, at a moment in time.
Opportunity Tree Example
.png?version=1&modificationDate=1617670035429&cacheVersion=1&api=v2&width=544&height=544)
Externalize work
Rituals
We will externalize our work as part of the following organization-standard rituals:
Squad Demos (/wiki/spaces/AT/pages/1742471458, sre)
Artifacts
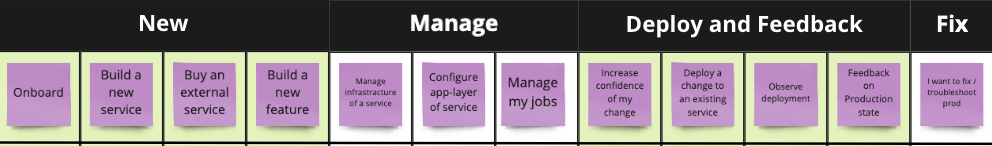
🔍 DISCOVER: Developer Journey Map
Starting with the user journey gives a high-level understanding of our user’s needs and a user-centric perspective of the high-level touchpoints with the products and services that we provide.
Arch example (link)

SRE example (link)
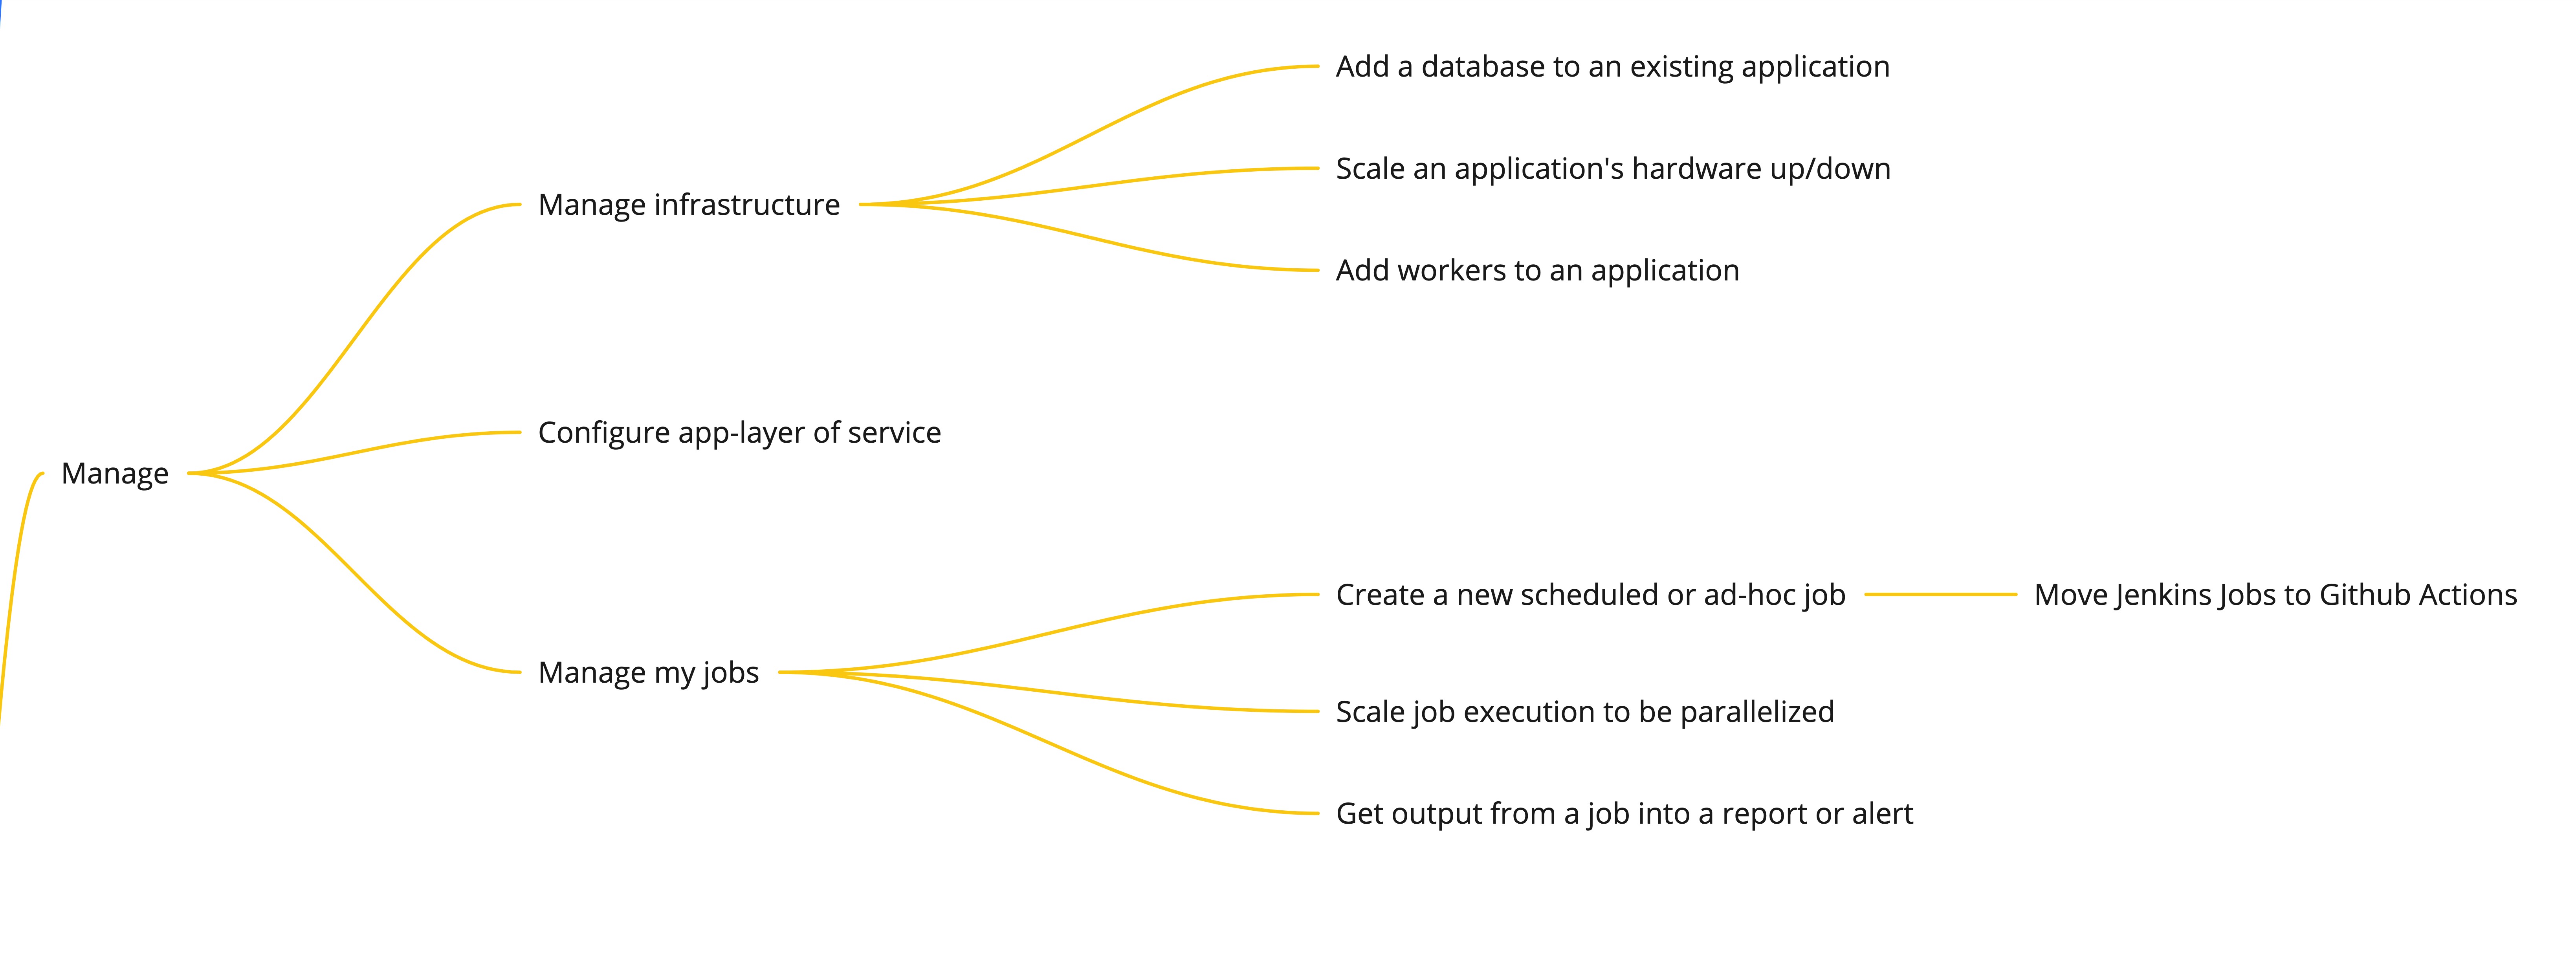
 IDEATE: Opportunity Tree
Here are some benefits to using an opportunity tree to explore the problem space:
Visualizes the team’s mental model of the problem space
Promotes the idea of many bets or multi-tracking towards the business outcome
Binds solutions in groupings (opportunities) that are themed, contextual and most importantly, aligned to the outcome
The trees can also be used in reverse; if you have a lot of ideas (or a backlog you’ve just taken over), you can work backward to the outcome and discard ideas that don’t align
Allows measuring at many levels — business outcome, opportunities, solutions, experiments
Ensures opportunities are exposed through generative research (like the Kata Table)
Note: we need to find a standard way to link opportunities to user insights.
Idea: The top-level depth of the opportunity tree can be taken from the developer journey described above. This allows the team to ideate against the desired outcome across each part of the developer journey.
Arch example (link)
.png?version=1&modificationDate=1617671800935&cacheVersion=1&api=v2&width=544&height=246)
SRE example (link)
🕰 PRIORITIZE: HPS & RICE & CD3
In order to prioritize amongst the various opportunities ideated, we use a structured template to further define and calculate the value and cost of each opportunity under consideration. The template has the following components:
HPS: Hypothesized Problem Statements (reference)
We believe that <this capability> |
RICE (reference)
|
CD3: Cost-of-delay over Duration (reference)
Incorporate the values from the RICE model into the CD3 equation, as follows:
Weekly Impact = (Weekly frequency of issue) * (# of hours lost each time) Cost-of-delay (hours lost weekly) = (Reach of developers) * (Weekly Impact) CD3 = Cost-of-delay / Effort |
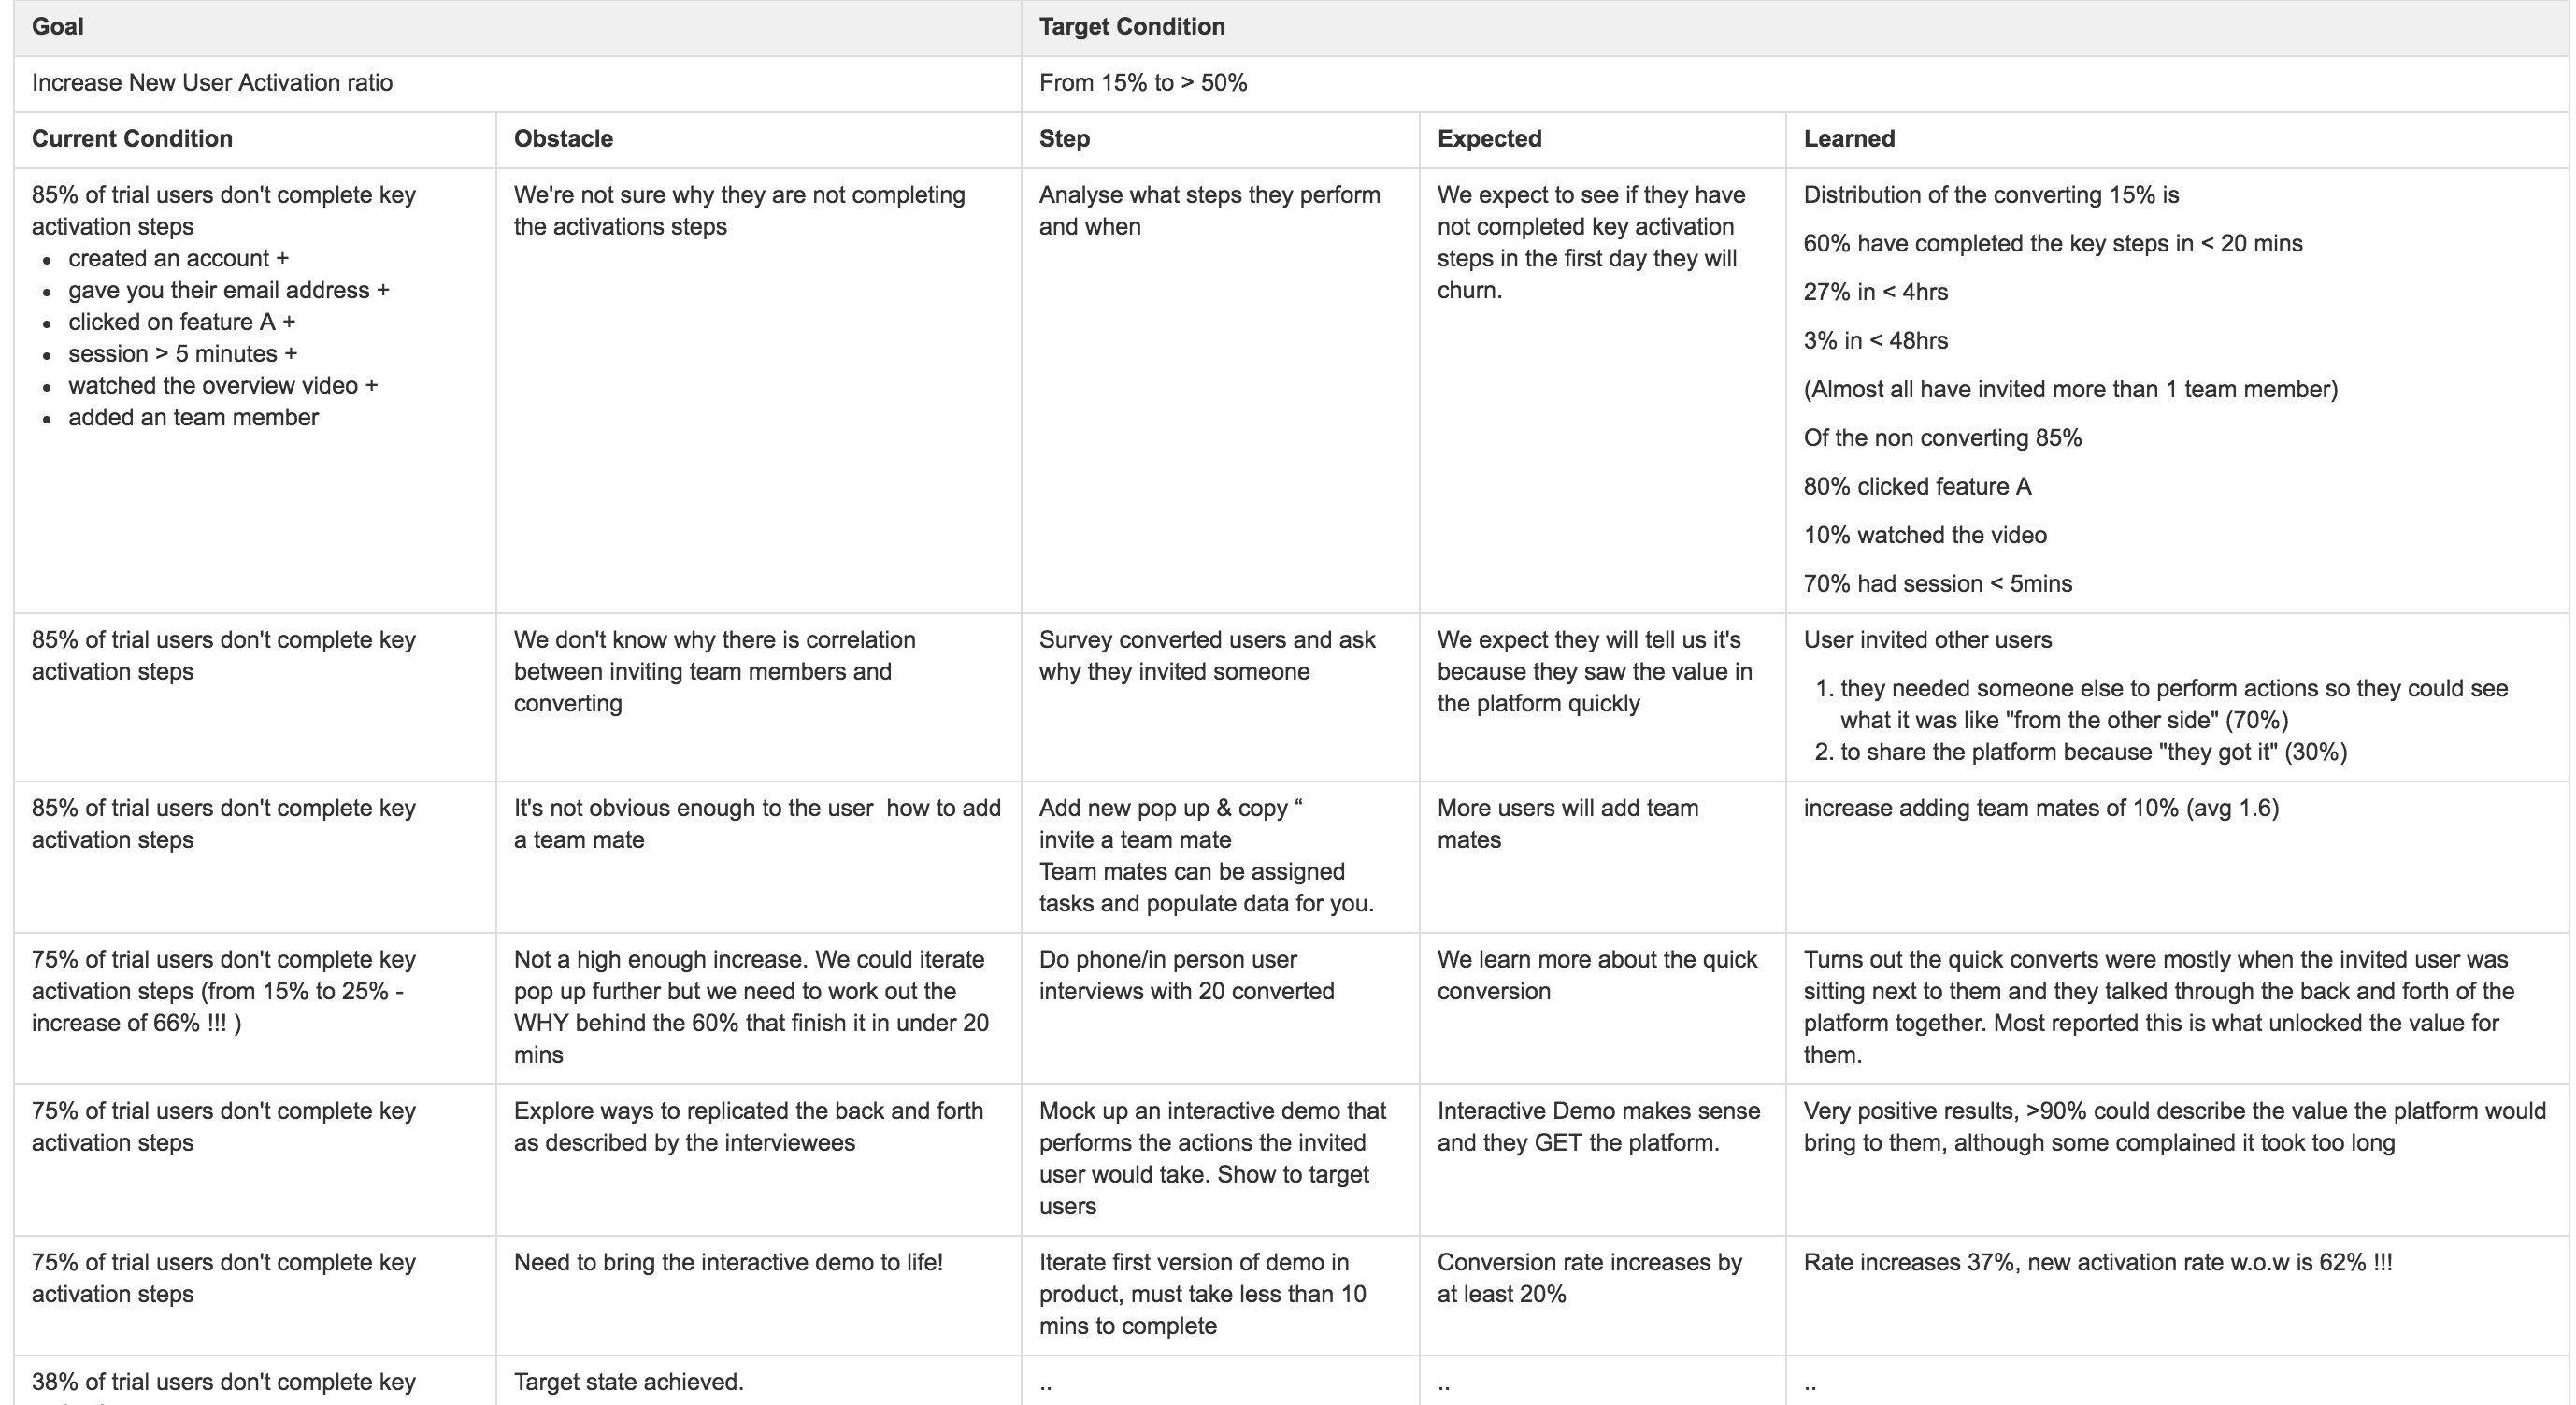
👩🎓 CONTINUOUSLY LEARN: Kata Table
“The process is about progressively solving problems, identifying the next step, and expanding understanding. Once there is sufficient understanding to anchor knowledge and take the next step, do so. Step and repeat. This framework will deepen your user knowledge and expose a host of opportunities and solutions to impact the business objective.” [reference]
Example
See how this team went from 85% of users not activating to 38% of users not activating, via iterations of learning. This is well externalized via this “Product Kata” table.
🗓 SET EXPECTATIONS: Roadmap
Provide a concise way to externalize the team’s roadmap. Rather than focusing on the date of delivery, include the following:
Columns: Places in the User Journey
Rows: Recent, Now, Next, Future