this load testing is being done to confirm performance of the forums due to the work done in PLAT-730 - Getting issue details... STATUS and the migration from compose.io to in house (AWS). One of the big concerns is that the "identity map" had been removed from mongoid. This
The initial intent here is to validate the performance that Diana Huang saw during her load testing of the forums service when the teams feature was added.
First the Basline from the teams test:
"Method" | "Name" | "# requests" | "# failures" | "Median response time" | "Average response time" | "Min response time" | "Max response time" | "Average Content Size" | "Requests/s" |
"GET" | "/commentable_id/threads" | 4341 | 0 | 330 | 459 | 18 | 14183 | 21159 | 2.48 |
"POST" | "/commentable_id/threads" | 1155 | 1 | 40 | 50 | 28 | 537 | 606 | 0.66 |
"GET" | "/search/threads" | 1134 | 0 | 63 | 135 | 34 | 5540 | 15294 | 0.65 |
"GET" | "/threads" | 7722 | 0 | 38 | 47 | 16 | 1158 | 20561 | 4.41 |
"GET" | "/threads/thread_id" | 30416 | 0 | 41 | 49 | 27 | 1104 | 5581 | 17.38 |
"POST" | "/threads/thread_id/comments" | 1062 | 7 | 120 | 132 | 67 | 969 | 525 | 0.61 |
"PUT" | "/threads/thread_id/votes" | 1102 | 0 | 32 | 44 | 25 | 420 | 1114 | 0.63 |
"GET" | "/users/user_id" | 54919 | 0 | 12 | 14 | 8 | 1036 | 52 | 31.37 |
"PUT" | "/users/user_id" | 4413 | 0 | 20 | 25 | 15 | 1046 | 62 | 2.52 |
"GET" | "/users/user_id/active_threads" | 1083 | 0 | 23 | 28 | 6 | 890 | 43 | 0.62 |
"GET" | "/users/user_id/subscribed_threads" | 1080 | 0 | 23 | 29 | 20 | 1056 | 40 | 0.62 |
"POST" | "/users/user_id/subscriptions" | 1067 | 0 | 24 | 30 | 16 | 221 | 95 | 0.61 |
"None" | "Total" | 109494 | 8 | 21 | 48 | 6 | 14183 | 4050 | 62.55 |
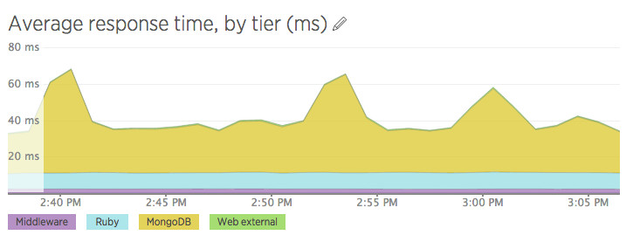
New Relic data: https://rpm.newrelic.com/accounts/88178/notes/4600
We can see by looking at this data that most of teh requests average response times are around 25 seconds. Looking at the charts in new Relic we can see that the majority of this time is spent in the mongodb layer:
Quick test 1 mongoid 4.0.2
"Method" | "Name" | "# requests" | "# failures" | "Median response time" | "Average response time" | "Min response time" | "Max response time" | "Average Content Size" | "Requests/s" |
"GET" | "/commentable_id/threads" | 1054 | 0 | 68 | 113 | 25 | 1507 | 20911 | 5.08 |
"POST" | "/commentable_id/threads" | 236 | 0 | 160 | 190 | 35 | 1527 | 629 | 1.14 |
"GET" | "/search/threads" | 265 | 0 | 140 | 244 | 37 | 2205 | 16065 | 1.28 |
"GET" | "/threads" | 1714 | 0 | 66 | 108 | 30 | 2140 | 17459 | 8.26 |
"GET" | "/threads/thread_id" | 7227 | 8 | 59 | 103 | 25 | 1575 | 901 | 34.82 |
"POST" | "/threads/thread_id/comments" | 254 | 0 | 220 | 267 | 74 | 930 | 529 | 1.22 |
"PUT" | "/threads/thread_id/votes" | 231 | 0 | 68 | 96 | 26 | 488 | 572 | 1.11 |
"GET" | "/users/user_id" | 12642 | 0 | 16 | 34 | 8 | 1413 | 56 | 60.92 |
"PUT" | "/users/user_id" | 966 | 0 | 16 | 32 | 9 | 991 | 62 | 4.65 |
"GET" | "/users/user_id/active_threads" | 264 | 0 | 37 | 66 | 20 | 1147 | 40 | 1.27 |
"GET" | "/users/user_id/subscribed_threads" | 226 | 0 | 47 | 75 | 20 | 410 | 40 | 1.09 |
"POST" | "/users/user_id/subscriptions" | 262 | 0 | 30 | 53 | 17 | 334 | 128 | 1.26 |
"None" | "Total" | 25341 | 8 | 37 | 69 | 8 | 2205 | 2524 | 122.10 |
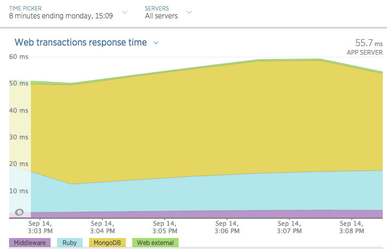
Quick test 2 Mongoid 4.0.2
"Method" | "Name" | "# requests" | "# failures" | "Median response time" | "Average response time" | "Min response time" | "Max response time" | "Average Content Size" | "Requests/s" |
"GET" | "/commentable_id/threads" | 6435 | 0 | 120 | 160 | 25 | 1783 | 21013 | 4.27 |
"POST" | "/commentable_id/threads" | 1634 | 0 | 230 | 282 | 45 | 3620 | 629 | 1.08 |
"GET" | "/search/threads" | 1608 | 0 | 240 | 370 | 40 | 4335 | 16433 | 1.07 |
"GET" | "/threads" | 11042 | 0 | 200 | 256 | 39 | 2963 | 17249 | 7.33 |
"GET" | "/threads/thread_id" | 44225 | 42 | 260 | 337 | 40 | 2769 | 3236 | 29.36 |
"POST" | "/threads/thread_id/comments" | 1537 | 2 | 380 | 442 | 78 | 4831 | 530 | 1.02 |
"PUT" | "/threads/thread_id/votes" | 1566 | 0 | 120 | 150 | 24 | 1224 | 573 | 1.04 |
"GET" | "/users/user_id" | 79514 | 0 | 89 | 122 | 14 | 2097 | 56 | 52.79 |
"PUT" | "/users/user_id" | 6352 | 0 | 24 | 37 | 9 | 1370 | 62 | 4.22 |
"GET" | "/users/user_id/active_threads" | 1545 | 0 | 130 | 172 | 29 | 1344 | 53 | 1.03 |
"GET" | "/users/user_id/subscribed_threads" | 1607 | 0 | 82 | 117 | 25 | 1502 | 41 | 1.07 |
"POST" | "/users/user_id/subscriptions" | 1599 | 0 | 71 | 106 | 18 | 1431 | 128 | 1.06 |
"None" | "Total" | 158664 | 44 | 130 | 197 | 9 | 4831 | 3171 | 105.34 |
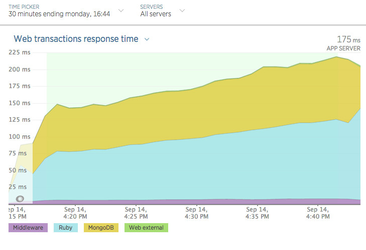
Overnight Soak Test 1
"Method" | "Name" | "# requests" | "# failures" | "Median response time" | "Average response time" | "Min response time" | "Max response time" | "Average Content Size" | "Requests/s" |
"GET" | "/commentable_id/threads" | 101926 | 0 | 86 | 102 | 26 | 10784 | 21044 | 1.99 |
"POST" | "/commentable_id/threads" | 25470 | 0 | 200 | 244 | 44 | 2232 | 629 | 0.50 |
"GET" | "/search/threads" | 25151 | 0 | 210 | 304 | 41 | 19457 | 16303 | 0.49 |
"GET" | "/threads" | 177330 | 0 | 190 | 246 | 41 | 10872 | 17244 | 3.46 |
"GET" | "/threads/thread_id" | 708856 | 671 | 380 | 486 | 46 | 11743 | 11165 | 13.84 |
"POST" | "/threads/thread_id/comments" | 25331 | 24 | 290 | 348 | 81 | 11524 | 529 | 0.49 |
"PUT" | "/threads/thread_id/votes" | 25266 | 0 | 93 | 122 | 27 | 10652 | 577 | 0.49 |
"GET" | "/users/user_id" | 1268480 | 0 | 130 | 170 | 21 | 10967 | 56 | 24.77 |
"PUT" | "/users/user_id" | 101212 | 0 | 26 | 36 | 9 | 10794 | 62 | 1.98 |
"GET" | "/users/user_id/active_threads" | 25739 | 0 | 150 | 194 | 33 | 5182 | 75 | 0.50 |
"GET" | "/users/user_id/subscribed_threads" | 25445 | 0 | 84 | 114 | 26 | 1494 | 47 | 0.50 |
"POST" | "/users/user_id/subscriptions" | 25310 | 0 | 74 | 100 | 20 | 2042 | 128 | 0.49 |
"None" | "Total" | 2535516 | 695 | 170 | 258 | 9 | 19457 | 5385 | 49.51 |
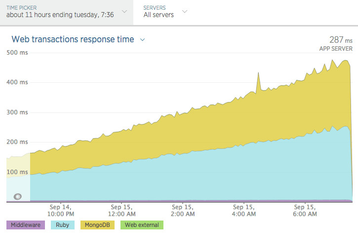
During the soak test the response times continued to ramp up continuously. The suspect