/
Figures, lightweight analytics, with John Baldwin
Figures, lightweight analytics, with John Baldwin
- Nimisha Asthagiri (Deactivated)
Owned by Nimisha Asthagiri (Deactivated)
Design Doc
Goals
- Fill niche between instructor dashboard and insights
- Share with other Open edX community to save effort, and community involvement
Customer profiles
- Corporations doing training on their products - training customers and training sales people
- Organization that has number of franchises
- (Future) Single Dashboard without going to multiple courses/places
Topics
- Coupling
- Model dependency
- Currently, pulling from Django models and Mongo data.
- Testing
- Unit testing within the app via Pytest
- Integration testing
- Integration points
- e.g., anonymizing via GDPR
- May need hooks so the core platform would know to call registered listeners.
- e.g., anonymizing via GDPR
- Model dependency
- Technology roadmap alignment (React, etc)
- Integration with edX pipeline and platform
- Want real-time data and not be downstream of pipeline
- Needing REST APIs in the platform
- Possible future
- Keeping the Analytics Data API as a contract.
- Then have implementations plugin.
- Could reuse frontend and React components
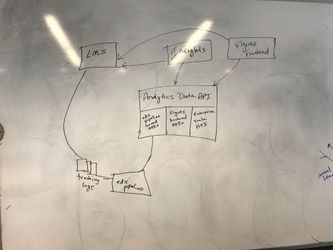
- Analytics Data API
- Option 1: Could theoretically pip install into the LMS
- Option 2: Make Analytics Data API a container for Plugins of Data APIs
- edx-pipeline generated data
- figures data API
- enterprise data API
- Further future: can the data or API be declared instead of being imperative?
- Keeping the Analytics Data API as a contract.
- Data
- What data is aggregated and not aggregated?
- Right now, only keeps aggregated data - so no PII.
- Total users and enrollments.
- What time series?
- Activity at a particular time.
- What data is aggregated and not aggregated?
- Maintainability
- Right now targeting Ginkgo
- APIs go away or Data models change
Other Notes
- Currently the Frontend is fully dependent on APIs, so dashboard can be replaced.
- Next iteration will have custom reports, can be added as widgets.
- Currently, reverse engineering the instructor dashboard code to understand the data model usage.
- They use APIs where they exist.
- Couldn't find enrollments API.
- Using Course Blocks API.
- CSV reports will contain user data.
- If there is no cache or local storage of that data, then it might be fine.
- Adding APIs
- OSPRs would be against master; while they are on Ginkgo.
- Need an API to list the users per course, with filtering.
- edX is also planning to invest in APIs - needed for Frontend and Backend split as well.
- However, thinking about those APIs from the business needs perspective, not necessarily from the data model perspective.
- Can look at Figures' business requirements as input to API discussion.
- Would like to see
- More things pulled out of the core.
- For Insights, we depended on the event log rather than the SQL models.
- We assumed the models would change more often.
- While the event log could be translated.
- Historically, though, it seems we never really changed our models.
- edX.org's scale would likely not be able to execute Figures as is it currently designed.
- Currently, testing out rebuilding the LMS - in React with decoupled backend.
- Cron tab
- Pulls from platform's data and puts in Figures' data model
- Figure's frontend calls APIs in Platform LMS as well as APIs for aggregated data in Figures
- Are real-time use cases a reality?
- How is progress going on a daily basis, generally.
- Going through the day, hour-by-hour
- for example, for communication campaign
- Jill's post in Discourse also asked for real-time
- edX has heard about the flipped classroom use case - where educator wants to know about learner's activity.
- Lightning talk - CSS modules
- As long as endpoints with APIs are maintained, with advanced notice of changes/deprecation.
Whiteboard of Option 2 possible future
, multiple selections available,
Related content
Open edX Analytics Ecosystem
Open edX Analytics Ecosystem
More like this
Data WG 2022-02-10 Meeting notes
Data WG 2022-02-10 Meeting notes
More like this
Platform-Level Analytics and Reporting
Platform-Level Analytics and Reporting
More like this
Open edX Data Project
Open edX Data Project
More like this
Learner Analytics API
Learner Analytics API
More like this
May 10, 2018 Agenda and Notes
May 10, 2018 Agenda and Notes
More like this